
Gamified
▸
+25% Windfall chance.

 Gamified


 Agile


 Synergized



 Lean






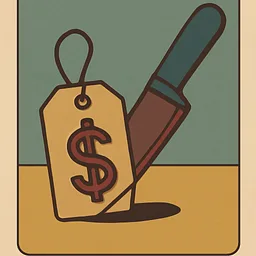

| Fiscal Year | Closing Valuation | Cumulative Wins | Cumulative Setbacks | Status |
|---|---|---|---|---|
| Year 1 | $110 | 0 | 1 | Setback |
| Year 2 | $160 | 1 | 1 | Stable |
| Year 3 | $220 | 2 | 1 | Stable |
| Year 4 | $355 | 3 | 1 | Stable |
| Year 5 | $430 | 4 | 1 | Stable |
| Year 6 | $505 | 5 | 1 | Stable |
| Year 7 | $655 | 6 | 1 | Stable |
| Year 8 | $805 | 7 | 1 | Stable |
| Year 9 | $880 | 8 | 1 | Domination |
Quarterly Shareholder Report →
At each year-end, an audit snapshot of Third Generation Holdings is filed to challenge rival corporate executives during their End-of-Year Showdowns.
Historical portfolio audits captured at the conclusion of each fiscal year.








 Synergized
 Synergized
 Lean
 Lean
 Synergized



 Synergized
 Lean
 Gamified
Synergized
Lean
 Gamified
Agile
Synergized
 Lean
Gamified
Agile
Synergized
Lean
Exhibit / Corporate Fingerprint
Composition of the final board